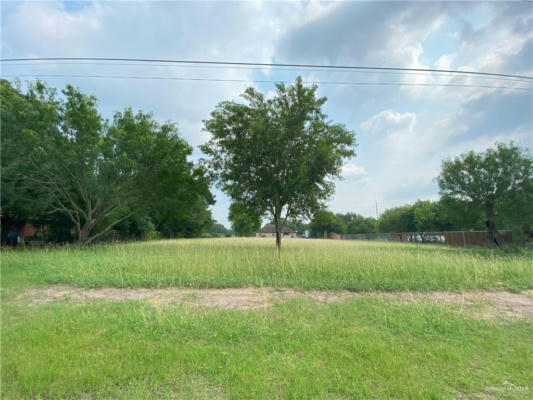
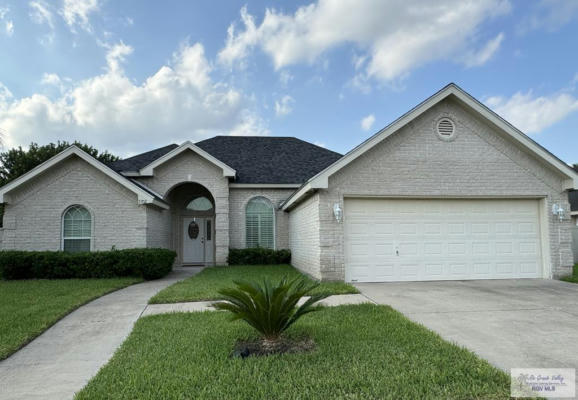
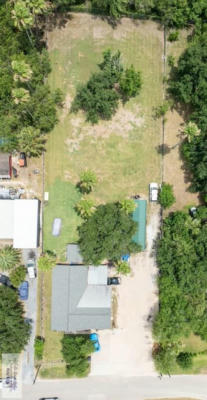
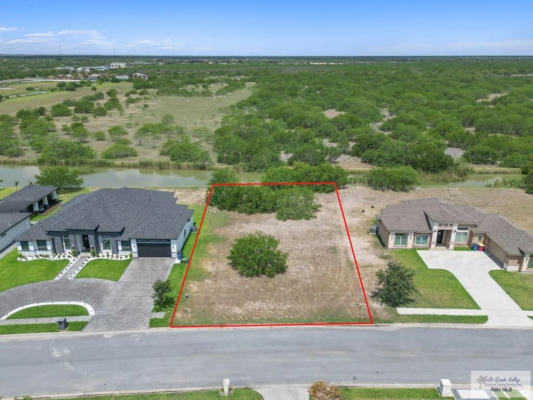
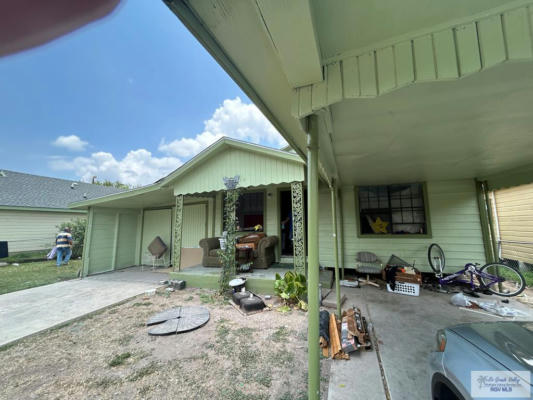
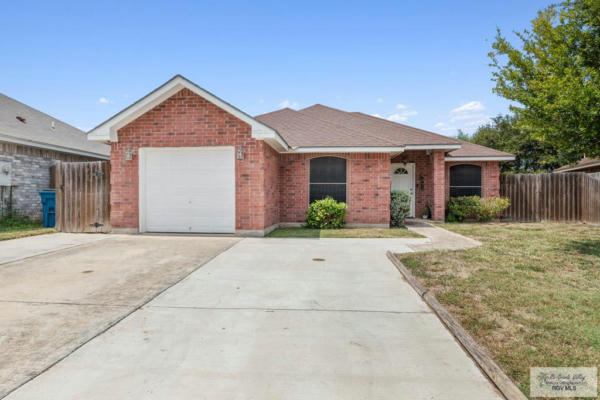
17593 RIO PANUCO AVE, HARLINGEN, TX 78552
$75,000
-Beds
0Baths
N/ASq Ft
Listing by Keller Williams Realty RGV
Sort:
Use arrows to control slideshow
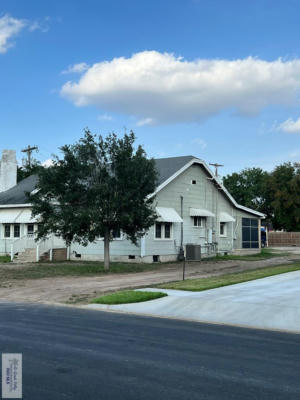
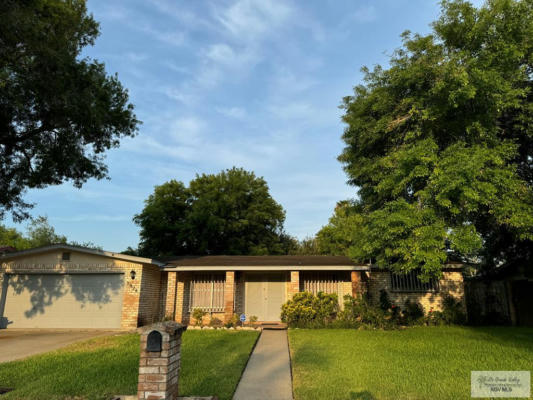
New Listing
-Beds
0Baths
N/ASq Ft
Use arrows to control slideshow
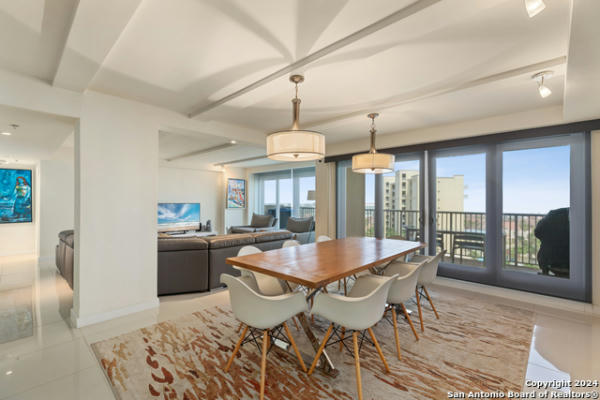
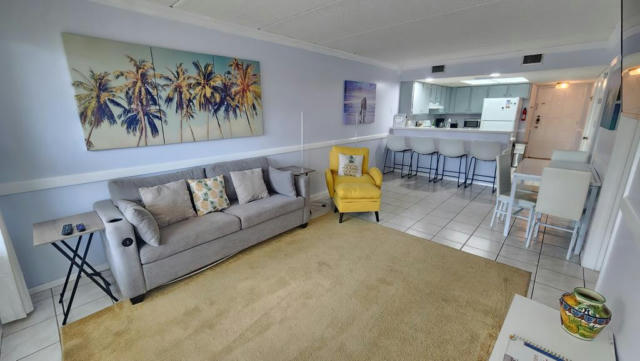
New Listing
2Beds
2Baths
1,320Sq Ft

Use arrows to control slideshow
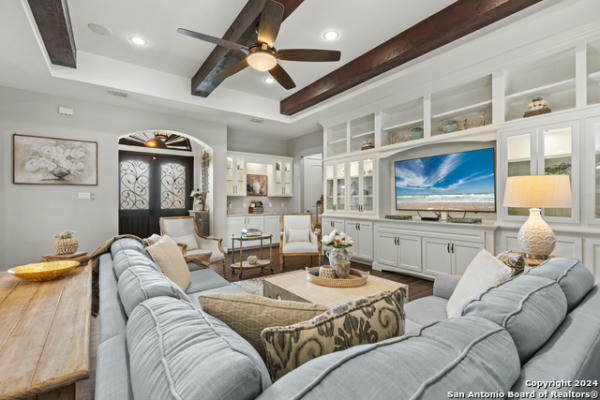
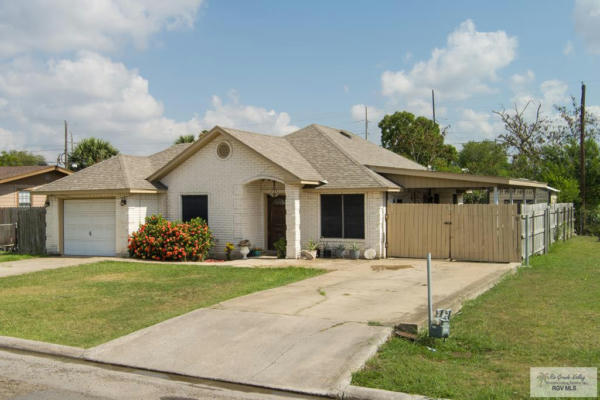
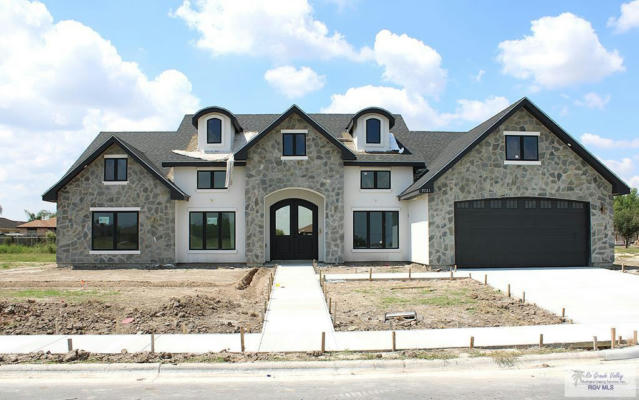
New Listing
3Beds
3Baths
2,298Sq Ft

Use arrows to control slideshow
Virtual Tour
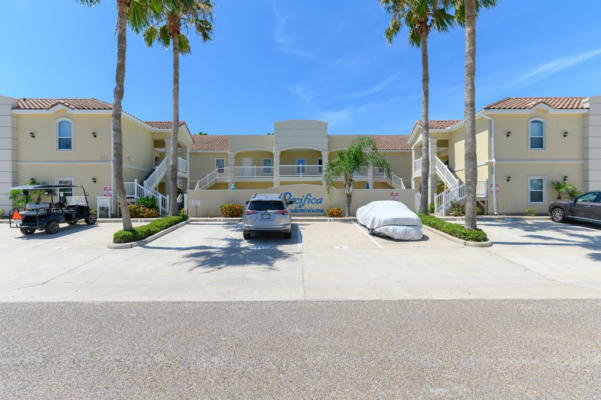
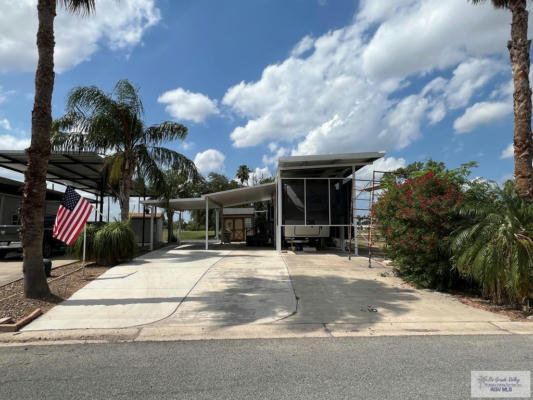
New Listing
2Beds
2Baths
1,135Sq Ft

Use arrows to control slideshow
New Listing
3Beds
2Baths
1,830Sq Ft
Use arrows to control slideshow
New Listing
3Beds
3Baths
1,738Sq Ft
Use arrows to control slideshow
New Listing
1Beds
1Baths
1,288Sq Ft
Use arrows to control slideshow
New Listing
3Beds
3Baths
1,815Sq Ft
Use arrows to control slideshow
New Listing
3Beds
3Baths
1,680Sq Ft
Use arrows to control slideshow
New Listing
4Beds
2Baths
2,035Sq Ft
Use arrows to control slideshow
New Listing
3Beds
3Baths
1,815Sq Ft
Use arrows to control slideshow
New Listing
3Beds
2Baths
1,128Sq Ft
Use arrows to control slideshow
New Listing
-Beds
0Baths
N/ASq Ft
Use arrows to control slideshow
New Listing
3Beds
3Baths
1,399Sq Ft
Use arrows to control slideshow
New Listing
3Beds
2Baths
1,715Sq Ft
Use arrows to control slideshow
New Listing
2Beds
2Baths
843Sq Ft
Use arrows to control slideshow
New Listing
3Beds
1Baths
1,257Sq Ft
Use arrows to control slideshow
Virtual Tour
New Listing
2Beds
2Baths
843Sq Ft
Use arrows to control slideshow
New Listing
-Beds
0Baths
N/ASq Ft
Pending
New Listing
4Beds
3Baths
2,182Sq Ft
Use arrows to control slideshow
New Listing
3Beds
2Baths
1,282Sq Ft
| Cities | Total Listings | Avg. List Price |
|---|---|---|
| 1. Houston, TX | 20,485 | $316,985 |
| 2. San Antonio, TX | 14,099 | $297,635 |
| 3. Austin, TX | 12,023 | $568,230 |
| 4. Northeast Dallas, TX | 7,425 | $537,490 |
| 5. Northwest Harris, TX | 6,769 | $380,673 |
| 6. Dallas, TX | 6,522 | $560,017 |
| 7. Southeast Montgomery, TX | 5,477 | $354,922 |
| 8. Fort Worth, TX | 5,435 | $324,957 |
| 9. El Paso, TX | 5,281 | $261,145 |
| 10. San Antonio Central, TX | 4,221 | $251,707 |
Total Listings and Average List Price are calculated by RE/MAX, LLC.