
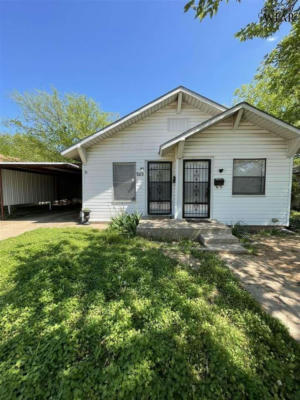
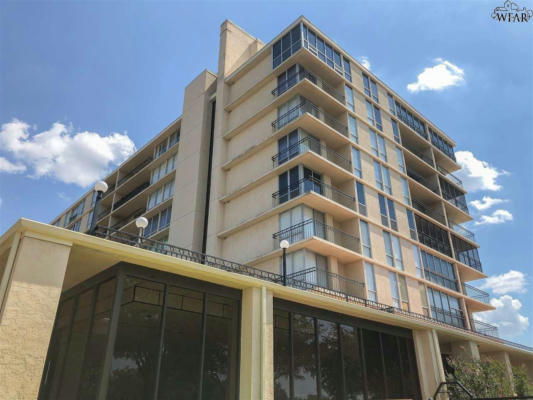
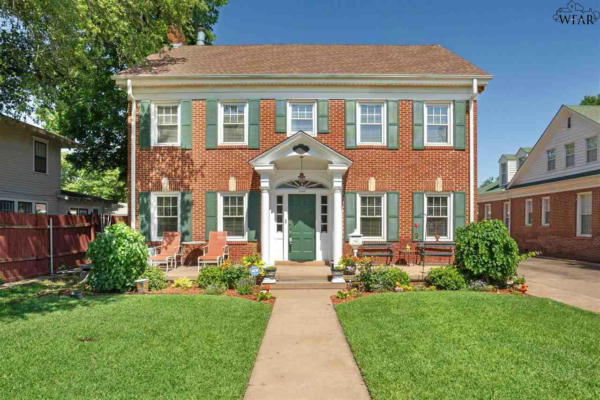
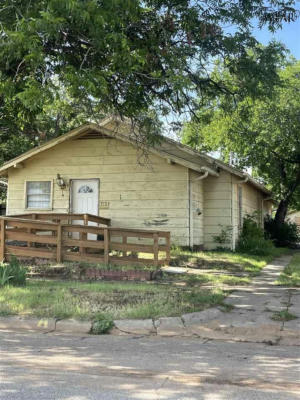
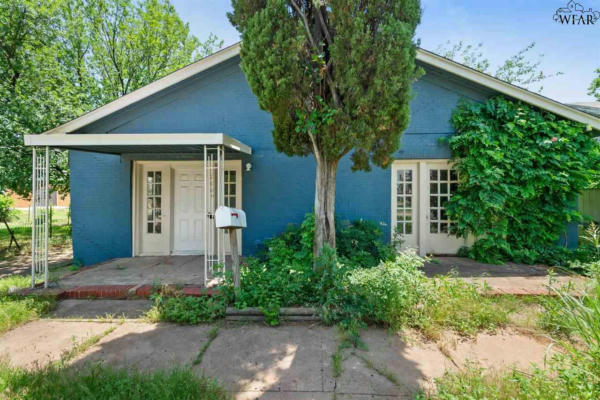
2113 FILLMORE ST, WICHITA FALLS, TX 76309
$825
-Beds
0Baths
790Sq Ft
Listing by PARAMOUNT REAL ESTATE SERVICES – CIARRA BIRCH
Sort:
Use arrows to control slideshow
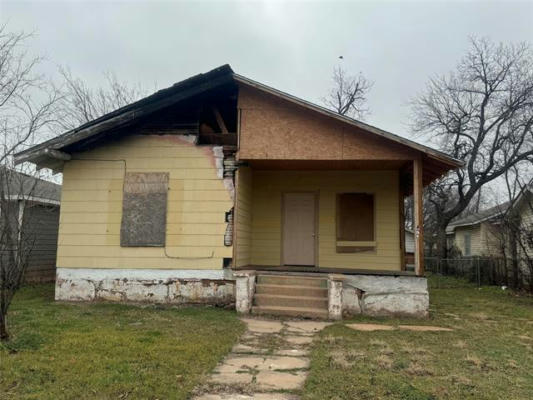
New Listing
-Beds
0Baths
790Sq Ft
Use arrows to control slideshow
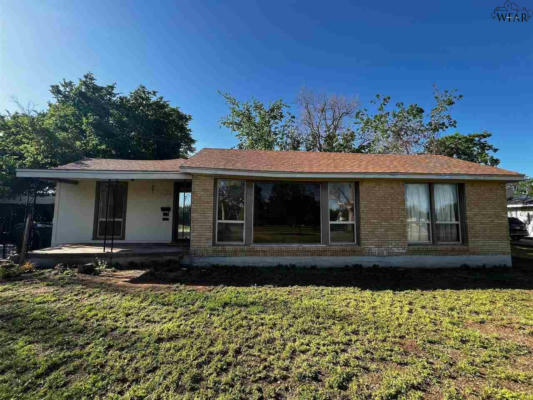
New Listing
-Beds
0Baths
790Sq Ft
Use arrows to control slideshow
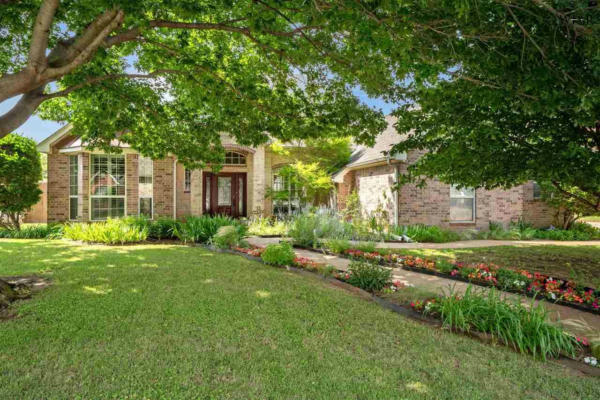
New Listing
3Beds
2Baths
1,853Sq Ft
Use arrows to control slideshow
New Listing
3Beds
1Baths
1,144Sq Ft
Use arrows to control slideshow
Virtual Tour
New Listing
4Beds
2Baths
1,778Sq Ft
Use arrows to control slideshow
Virtual Tour
New Listing
3Beds
2Baths
2,034Sq Ft

Use arrows to control slideshow
Under Contract
New Listing
2Beds
2Baths
1,443Sq Ft
Use arrows to control slideshow
3D Virtual Tour
New Listing
3Beds
3Baths
2,110Sq Ft
Use arrows to control slideshow
Virtual Tour
New Listing
3Beds
3Baths
2,584Sq Ft
Use arrows to control slideshow
New Listing
2Beds
2Baths
1,219Sq Ft
Use arrows to control slideshow
New Listing
2Beds
1Baths
956Sq Ft
Use arrows to control slideshow
Under Contract
New Listing
2Beds
1Baths
1,040Sq Ft
Use arrows to control slideshow
New Listing
2Beds
2Baths
2,245Sq Ft
Use arrows to control slideshow
Virtual Tour
New Listing
4Beds
3Baths
2,820Sq Ft
Use arrows to control slideshow
Virtual Tour
New Listing
3Beds
2Baths
1,314Sq Ft
Use arrows to control slideshow
New Listing
3Beds
2Baths
1,537Sq Ft
Use arrows to control slideshow
Pending
New Listing
4Beds
4Baths
2,659Sq Ft
Use arrows to control slideshow
New Listing
-Beds
0Baths
706Sq Ft
Use arrows to control slideshow
Pending
New Listing
3Beds
2Baths
1,692Sq Ft
Use arrows to control slideshow
New Listing
3Beds
2Baths
1,517Sq Ft
Use arrows to control slideshow
Under Contract
New Listing
3Beds
2Baths
1,963Sq Ft
| Cities | Total Listings | Avg. List Price |
|---|---|---|
| 1. Houston, TX | 20,610 | $316,014 |
| 2. San Antonio, TX | 14,215 | $297,629 |
| 3. Austin, TX | 12,046 | $566,346 |
| 4. Northeast Dallas, TX | 7,554 | $540,782 |
| 5. Northwest Harris, TX | 6,803 | $380,590 |
| 6. Dallas, TX | 6,630 | $564,068 |
| 7. Fort Worth, TX | 5,529 | $321,377 |
| 8. Southeast Montgomery, TX | 5,512 | $352,037 |
| 9. El Paso, TX | 5,308 | $261,315 |
| 10. San Antonio Central, TX | 4,249 | $251,426 |
Total Listings and Average List Price are calculated by RE/MAX, LLC.